您好,欢迎访问三七文档
当前位置:首页 > 商业/管理/HR > 质量控制/管理 > Quality Control很全面的品质管控(英文版)
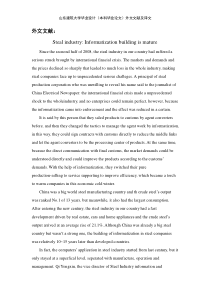
112002South-Western/ThomsonLearning2002South-Western/ThomsonLearningTMTMSlidespreparedSlidespreparedbyJohnLoucksbyJohnLoucks2Chapter17QualityControl3OverviewIntroductionStatisticalConceptsinQualityControlControlChartsAcceptancePlansComputersinQualityControlQualityControlinServicesWrap-Up:WhatWorld-ClassCompaniesDo4IntroductionQualitycontrol(QC)includestheactivitiesfromthesuppliers,throughproduction,andtothecustomers.Incomingmaterialsareexaminedtomakesuretheymeettheappropriatespecifications.Thequalityofpartiallycompletedproductsareanalyzedtodetermineifproductionprocessesarefunctioningproperly.Finishedgoodsandservicesarestudiedtodetermineiftheymeetcustomerexpectations.5QCThroughoutProductionSystemsRawMaterials,Parts,andSuppliesProductionProcessesProductsandServicesInputsConversionOutputsControlChartsandAcceptanceTestsControlChartsandAcceptanceTestsControlChartsQualityofInputsQualityofOutputsQualityofPartiallyCompletedProducts6ServicesandTheirCustomerExpectationsHospitalPatientreceivethecorrecttreatments?Patienttreatedcourteouslybyallpersonnel?Hospitalenvironmentsupportpatientrecovery?BankCustomer’stransactionscompletedwithprecision?Bankcomplywithgovernmentregulations?Customer’sstatementsaccurate?7ProductsandTheirCustomerExpectationsAutomakerAutohavetheintendeddurability?Partswithinthemanufacturingtolerances?Auto’sappearancepleasing?LumbermillLumberwithinmoisturecontenttolerances?Lumberproperlygraded?Knotholes,splits,andotherdefectsexcessive?8SamplingTheflowofproductsisbrokenintodiscretebatchescalledlots.Randomsamplesareremovedfromtheselotsandmeasuredagainstcertainstandards.Arandomsampleisoneinwhicheachunitinthelothasanequalchanceofbeingincludedinthesample.Ifasampleisrandom,itislikelytoberepresentativeofthelot.9SamplingEitherattributesorvariablescanbemeasuredandcomparedtostandards.Attributesarecharacteristicsthatareclassifiedintooneoftwocategories,usuallydefective(notmeetingspecifications)ornondefective(meetingspecifications).Variablesarecharacteristicsthatcanbemeasuredonacontinuousscale(weight,length,etc.).10SizeandFrequencyofSamplesAsthepercentageoflotsinsamplesisincreased:thesamplingandsamplingcostsincrease,andthequalityofproductsgoingtocustomersincreases.Typically,verylargesamplesaretoocostly.Extremelysmallsamplesmightsufferfromstatisticalimprecision.Largersamplesareordinarilyusedwhensamplingforattributesthanforvariables.11WhentoInspectDuringtheProductionProcessInspectbeforecostlyoperations.Inspectbeforeoperationsthatarelikelytoproducefaultyitems.Inspectbeforeoperationsthatcoverupdefects.Inspectbeforeassemblyoperationsthatcannotbeundone.Onautomaticmachines,inspectfirstandlastpiecesofproductionruns,butfewin-betweenpieces.Inspectfinishedproducts.12CentralLimitTheoremThecentrallimittheoremis:Samplingdistributionscanbeassumedtobenormallydistributedeventhoughthepopulation(lot)distributionsarenotnormal.Thetheoremallowsuseofthenormaldistributiontoeasilysetlimitsforcontrolchartsandacceptanceplansforbothattributesandvariables.13SamplingDistributionsThesamplingdistributioncanbeassumedtobenormallydistributedunlesssamplesize(n)isextremelysmall.Themeanofthesamplingdistribution(x)isequaltothepopulationmean(m).Thestandarderrorofthesamplingdistribution(sx)issmallerthanthepopulationstandarddeviation(sx)byafactorof1/=-n14PopulationandSamplingDistributionsf(x)xPopulationDistributionSamplingDistributionofSampleMeansMean=mStd.Dev.=sxMean=x=mStd.Error=xxσσ=nf(x)=x15ControlChartsPrimarypurposeofcontrolchartsistoindicateataglancewhenproductionprocessesmighthavechangedsufficientlytoaffectproductquality.Iftheindicationisthatproductqualityhasdeteriorated,orislikelyto,thencorrectiveistaken.Iftheindicationisthatproductqualityisbetterthanexpected,thenitisimportanttofindoutwhysothatitcanbemaintained.Useofcontrolchartsisoftenreferredtoasstatisticalprocesscontrol(SPC).16ConstructingControlChartsVerticalaxisprovidesthescaleforthesampleinformationthatisplottedonthechart.Horizontalaxisisthetimescale.Horizontalcenterlineisideallydeterminedfromobservingthecapabilityoftheprocess.Twoadditionalhorizontallines,theloweranduppercontrollimits,typicallyare3standarddeviationsbelowandabove,respectively,thecenterline.17ConstructingControlChartsIfthesampleinformationfallswithintheloweranduppercontrollimits,thequalityofthepopulationisconsideredtobeincontrol;otherwisequalityisjudgedtobeoutofcontrolandcorrectiveactionshouldbeconsidered.TwoversionsofcontrolchartswillbeexaminedControlchartsforattributesControlchartsforvariables18ControlChartsforAttributesInspectionoftheunitsinthesampleisperformedonanattribute(defective/non-defective)basis.Informationprovidedfrominspectingasampleofsizenisthepercentdefectiveinasample,p,orthenumberofunitsfoundtobedefectiveinthatsampledividedbyn.19Althoughthedistributionofsampleinformationfollowsabinomialdistribution,thatdistributioncanbeapproximatedbyanormaldistributionwithameanofpstandarddeviationofThe3scontrollimitsare)/np(100p)/np(100p3-/pControlChartsforA
 三七文档所有资源均是用户自行上传分享,仅供网友学习交流,未经上传用户书面授权,请勿作他用。
 扫描二维码
扫描二维码


 mashilong520
本文标题:Quality Control很全面的品质管控(英文版)
链接地址:https://www.777doc.com/doc-426132 .html