您好,欢迎访问三七文档
当前位置:首页 > 商业/管理/HR > 公司方案 > 富营养化水体中芦苇和菖蒲浮床氮净化能力比较研究
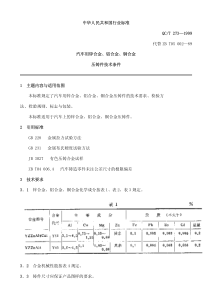
1、。。、、、[1-3]。。Cannaindica、Phragmitesaustralis、Eichhorniacrassipes[24-5]。。TN。TNTN9.63、4.58mg·L-1TN91.5%84.2%89.9%82.8%36.4%~77.1%。2dTN4.20、1.77mg·L-1·d-11.75、1.04mg·L-1·d-1。、3TNR≥0.826P0.01TN。X173A1672-2043201311-2258-06doi:10.11654/jaes.2013.11.0221211*12121.1301022.100049AComparativeStudyonNitrogenRemovalfromPollutedWaterbyFloatingBedsPlantedwithPhragmitesaustralisandAcoruscalamusDENGZhi-qiang1,2,LIXu-hui1,YANBai-xing1*,ZHANGYan1,2,L譈Dui-an1,21.KeyLaboratoryofWetlandEcologyandEnvironment,Northea。
2、stInstituteofGeographyandAgroecology,ChineseAcademyofSciences,Changchun130102,China;2.UniversityofChineseAcademyofSciences,Beijing100049,ChinaAbstractLab-scaleexperimentswerecarriedouttocomparetheefficiencyofnitrogenNremovalbyfloatingbedsplantedwithcommonreedPhragmitesaustralisandcalamusAcoruscalamusineutrophicwaterman-madefromwaterofKhankaLake.Therhizomecharac-teristicsandtheefficiencyandrateofnitrogenremovalbyPhragmitesaustralisandAcoruscalamuswereexaminedtostudynitrogenremovalmechanismsandmaj。
3、orinfluencingfactors.ResultsdemonstratedthatfloatingbedsplantedwithPhragmitesaustralis3replicasandA-coruscalamus3replicashadwaterpurifyingability.TheaverageTNremovalpercentagewas91.5%and84.2%forthereedbedsand89.9%and82.8%forthecalamusbedsat9.63mg·L-1feedAand4.58mg·L-1feedBofTNconcentrationsinthefeedwater,respec-tively.Plantuptakecontributedto36.4%~77.1%ofTNremoval.ThemeanTNremovalratebythereedbedsatlategrowthstagewas4.20mg·L-1·d-1and1.77mg·L-1·d-1,whilethatofthecalamusbedswas1.75mg·L-1·d-1and1.0。
4、4mg·L-1·d-1,respectively,forfeedAandfeedB.SignificantcorrelationsR≥0.826andP0.01werefoundbetweenTNremovalratesandtotallength,surfaceareaandvolumeofplantroots.Theplantrootsisfoundtobethedeterminantfactorofnitrogenremovalefficiencyinfloatingbeds.Keywordseutrophication;nitrogen;purificationcapacity;Phragmitesaustralis;Acoruscalamus2013-01-172012ZX07201004412015201987—。E-maildengzhilong1121@126.com*E-mailyanbx@neigae.ac.cn20133211:2258-2263201311JournalofAgro-EnvironmentScience3212013111Table1Initia。
5、lwaterqualityofsimulatedwastewater。[6-7]。TN、NH+4-NNO-3-NAcoruscalamus。11.1。33cm、34cm15L25cm×25cm×3.5cm。53cm、1。。10cm30cm14cm20cm。1.2NH4NO3KH2PO41201215~26℃。33。10d7。pH、TN、NH+4-NNO-3-N。3、572、4、7d。、65℃。、。1.3TNGB/T11894—1989NH+4-NGB7479—1987NO-3-NHJ346—2007pHGB6920—1986。H2SO4-H2O2[8]。Expression10000XLWinRHIZO、。1.4ExcelSPSS17.0tPearson。22.1A66.2cm57.3cmB53.7cm41.1cmP0.05。31。、。AB2。A、675mg622mg3。B264mg147mgP0.05。ABP0.01。2.2AB414m258m22.6m12.3mTN/mg·L-1TP/mg·L-1NH+4-N/mg·L-1NO-3-N/mg·L-1pHA9.63±0.851.02±。
6、0.145.06±0.494.80±0.216.82±0.10B4.58±0.460.50±0.082.52±0.332.24±0.276.76±0.131Figure1RelativegrowthratesofP.australisandA.calamusindifferentwastewater1.00.80.60.40.20628AABB93710721731812823225932113NTable3Netremovalandplantuptakeofnitrogenfromwastewatera、b、ctP0.05。N/mgN/mg/mg/mg/%A102286.7935675a72.2a96398.0865622a77.1aB47775.5401264b66.4a48684.0403147c36.4b4、Table4RootcharacteristicsofsingleP.australisandA.calamusattheendoftheexperiment/m/×103cm2/cm3A414±8122.6±3.45.40±0.680.38±0.0658.0±14.05.。
7、16±0.76B258±11812.3±3.43.14±14.80.23±0.0430.9±14.93.46±0.842Table2BiomassandnitrogenconcentrationsofP.australisandA.calamusbeforeandaftertheexperimentP0.014。。2.3、pH、6.7~7.5pH3Kyambadde[9]。H+、CO2pH[10]。A7TN91.5%89.9%48.7%P0.05TN0.83、0.94mg·L-14.99mg·L-1P0.012。B84.2%82.8%61.3%P0.05TN。AB。AN935、865mg72.2%77.1%3。BN401、403mg66.4%36.4%。N。AB、2~4dTN7d10d3。ABNH+4-NNO-3-N4。A、2dTN2.95、3.85、4.20mg·L-1·d-11.53、1.57、1.77mg·L-1·d-1ABTN2。3A2dTN4.20mg·L-1·d-11.75mg·L-1·d-1P0.01。、P0.01、Pearson0.969、0.9830.950P0.01。
8、。B2dTN1.77、1.04mg·L-1·d-1/g/gN/mg·g-1/g/gN/mg·g-17.58±1.482.44±0.4118.3±2.011.17±0.992.85±0.4914.8±1.715.14±4.342.72±0.6021.0±2.7628.6±4.287.86±1.3714.5±1.18A59.53±5.6827.83±3.8917.1±1.870.58±5.9527.95±1.8710.4±0.346.88±10.6812.45±4.3924.2±6.889.36±21.4226.20±7.1221.5±2.4B32.09±5.2018.23±2.7811.3±0.650.76±5.2619.61±3.039.14±0.5918.90±3.755.56±0.6817.6±2.544.96±10.8813.60±1.5315.3±0.522603212013111086420ATN/mg·L-11234567100806040200ATN/%123456743210BTN/mg·L-11234567100806040200BTN/%12345672NFigur。
9、e2Concentrationsandremovalefficienciesoftotalnitrogenindifferentwastewaterattheendofsevenperiods33TNFigure3Changesoftotalnitrogenconcentrationsinwastewaterduringthreegrowthperiods、Pearson0.865、0.8510.826P0.05。[911-12]。。DeStefani[13]Dactylisglom-erataSile8115cmChrysopogonzizanioides。A91.5%B84.2%P0.05。543210t/dBTN/mg·L-1543210t/d543210t/d1086420t/dATN/mg·L-1024681086420t/dt/dBTN/mg·L-1ATN/mg·L-1BTN/mg·L-1ATN/mg·L-1100246810024681002468100246810024681010864202261321143ANH+4-NNO-3-NFigure4ChangesofN。
10、H+4-NandNO-3-NconcentrationsofwastewaterAinthreegrowthperiods6543210543210543210t/dNH+4-N/mg·L-102468543210t/dNO-3-N/mg·L-1543210t/dt/d6543210t/dt/dANB2A。A3[14]。、、。Kyambadde[9]Cyperuspa-pyrusL.69.5%Reddy[15]、Egeriadensa816%~75%36.4%~77.1%。K觟rner[16]LemnagibbaL.30%~47%Sekiran-daKiwanuka[17]Phragmitesmauritianus19%TN9.63mg·L-14.58mg·L-110d。、[16-17][18-19]。pH8。NH+4-NNO-3-NNO-3-N4[15]。。ATN48.7%B61.3%。B36.4%。。。AB[20-21]。PetersonTeal[22]15.6gN·m-2·d-1N4%0.44~1.83gN·m-2·d-130%N。1002468100。
 三七文档所有资源均是用户自行上传分享,仅供网友学习交流,未经上传用户书面授权,请勿作他用。
 扫描二维码
扫描二维码


 fisherniu
本文标题:富营养化水体中芦苇和菖蒲浮床氮净化能力比较研究
链接地址:https://www.777doc.com/doc-6562037 .html